Recently, I shared a post that demonstrated how to integrate CorePlot into your Swift-based iOS project. That post covered the basics of how to get started, but there’s an issue with using CorePlot which can cause problems pretty quickly once you get into building your graphs.
CorePlot makes heavy use of the NSDecimal type in Objective-C, which is a special C struct used to store decimal numbers. Swift doesn’t directly support NSDecimal, so any methods that use it in CorePlot APIs are simply missing when you try to access them from Swift.
If you haven’t checked out the previous post, you’ll want to do that first. Starting from that app, we’ll replace all of the graph drawing code with some new code to build a scatter plot. We’ll just have some mock data, with four records, each with the x and y values set to the same number (1 through 4):
This file contains hidden or bidirectional Unicode text that may be interpreted or compiled differently than what appears below. To review, open the file in an editor that reveals hidden Unicode characters.
Learn more about bidirectional Unicode characters
| // | |
| // ViewController.swift | |
| // CorePlotTest | |
| // | |
| // Created by Al Wold on 8/6/14. | |
| // Copyright (c) 2014 Al Wold. All rights reserved. | |
| // | |
| import UIKit | |
| class ViewController: UIViewController, CPTPlotDataSource { | |
| @IBOutlet weak var graphView: CPTGraphHostingView! | |
| override func viewDidLoad() { | |
| super.viewDidLoad() | |
| // create graph | |
| var graph = CPTXYGraph(frame: CGRectZero) | |
| graph.title = "Hello Graph" | |
| var plot = CPTScatterPlot() | |
| plot.dataSource = self | |
| graph.addPlot(plot) | |
| self.graphView.hostedGraph = graph | |
| } | |
| func numberOfRecordsForPlot(plot: CPTPlot!) -> UInt { | |
| return 4 | |
| } | |
| func numberForPlot(plot: CPTPlot!, field fieldEnum: UInt, recordIndex idx: UInt) -> NSNumber! { | |
| return idx+1 | |
| } | |
| override func didReceiveMemoryWarning() { | |
| super.didReceiveMemoryWarning() | |
| // Dispose of any resources that can be recreated. | |
| } | |
| } | |
You should get something like this:

As you can see, there’s nothing there. This is because the range on our plot isn’t big enough to show the graph. We need to set the length values for the x and y ranges on the default plot space. Our approach will be like this:
- Get the default plot space for the graph
- Get the x range of the plot space
- Create a mutable copy of the x range
- Set the x range’s length
- Set the x range on the plot space to our new mutable copy
- Repeat for the y range
Everything goes fine until you try to set the length of the x range. The length property on the CPTMutablePlotRange is represented as an NSDecimal, so it isn’t bridged into Swift.
Luckily, there’s a pretty easy workaround. By adding a Category for the classes you are using, you can add wrapper methods which use a supported Swift data type. In our case, we’ll be wrapping the CPTMutablePlotRange object in CorePlot, so that we can set the area displayed by our graph.
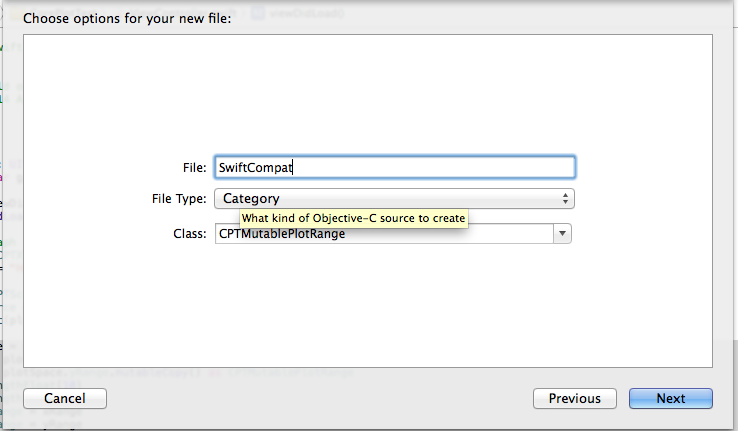
- In XCode, select File->New->File
- Select iOS->Source->Objective-C File
- For the File Type, select Category, then fill it in like this:
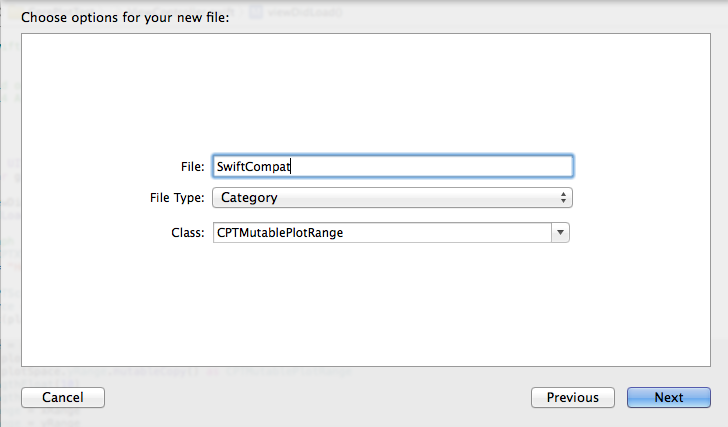
This will create a file called CPTMutablePlotRange+SwiftCompat.h/m. All of the methods we add in the category will be accessible each time we encounter a CPTMutablePlotRange in our app. We’ll just add a method to set the length as a float instead of an NSDecimal:
This file contains hidden or bidirectional Unicode text that may be interpreted or compiled differently than what appears below. To review, open the file in an editor that reveals hidden Unicode characters.
Learn more about bidirectional Unicode characters
| // | |
| // CPTMutablePlotRange+SwiftCompat.h | |
| // CorePlotTest | |
| // | |
| // Created by Al Wold on 8/29/14. | |
| // Copyright (c) 2014 Al Wold. All rights reserved. | |
| // | |
| #import <UIKit/UIKit.h> | |
| #import "CPTMutablePlotRange.h" | |
| @interface CPTMutablePlotRange (SwiftCompat) | |
| – (void)setLengthFloat:(float)lengthFloat; | |
| @end |
This file contains hidden or bidirectional Unicode text that may be interpreted or compiled differently than what appears below. To review, open the file in an editor that reveals hidden Unicode characters.
Learn more about bidirectional Unicode characters
| // | |
| // CPTMutablePlotRange+SwiftCompat.m | |
| // CorePlotTest | |
| // | |
| // Created by Al Wold on 8/29/14. | |
| // Copyright (c) 2014 Al Wold. All rights reserved. | |
| // | |
| #import "CPTMutablePlotRange+SwiftCompat.h" | |
| @implementation CPTMutablePlotRange (SwiftCompat) | |
| – (void)setLengthFloat:(float)lengthFloat | |
| { | |
| NSNumber *number = [NSNumber numberWithFloat:lengthFloat]; | |
| [self setLength:[number decimalValue]]; | |
| } | |
| @end |
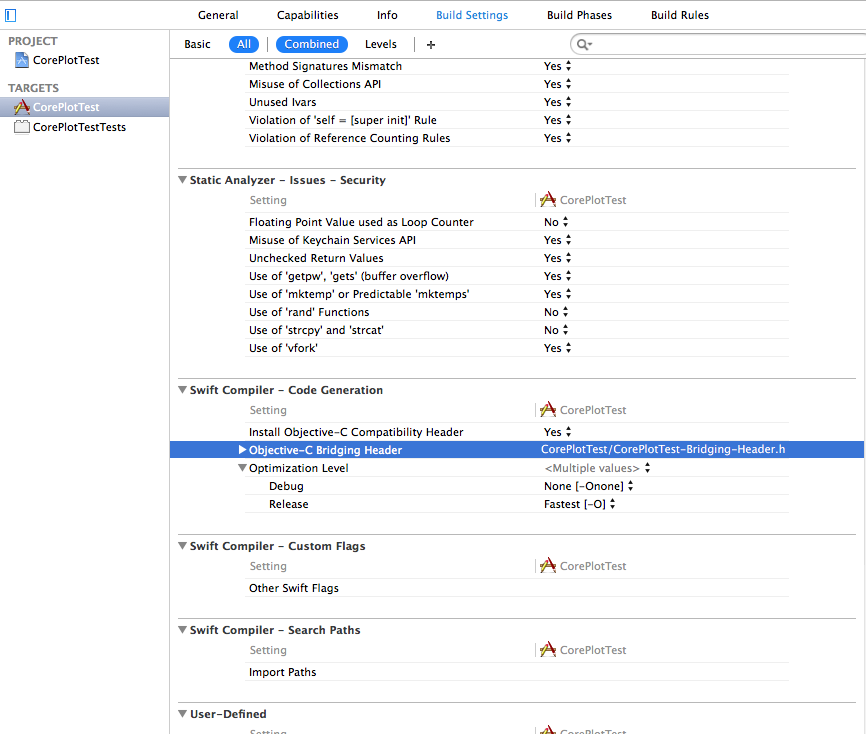
The last step is to make sure to import CPTMutablePlotRange+SwiftCompat.h in your bridging header (see the previous post for how to set up your bridging header). Once you do that, you should be able to access the new setLengthFloat method any time you encounter a CPTMutablePlotRange.
So, let’s add some more code to the ViewController.swift to set the lengths:
This file contains hidden or bidirectional Unicode text that may be interpreted or compiled differently than what appears below. To review, open the file in an editor that reveals hidden Unicode characters.
Learn more about bidirectional Unicode characters
| var plotSpace = graph.defaultPlotSpace as CPTXYPlotSpace | |
| var xRange = plotSpace.xRange.mutableCopy() as CPTMutablePlotRange | |
| var yRange = plotSpace.yRange.mutableCopy() as CPTMutablePlotRange | |
| xRange.setLengthFloat(10) | |
| yRange.setLengthFloat(10) | |
| plotSpace.xRange = xRange | |
| plotSpace.yRange = yRange |
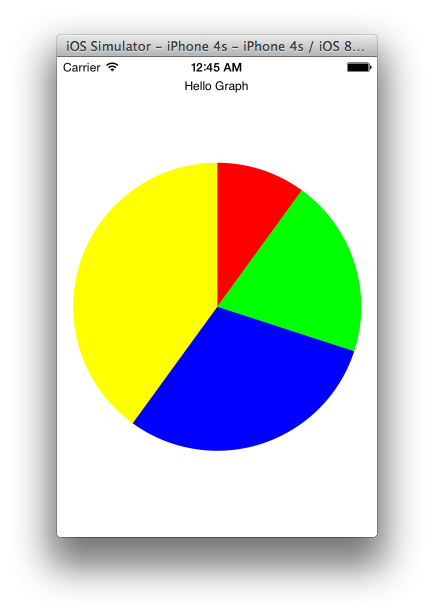
Once this is added, we run the app and get a graph that looks like this:
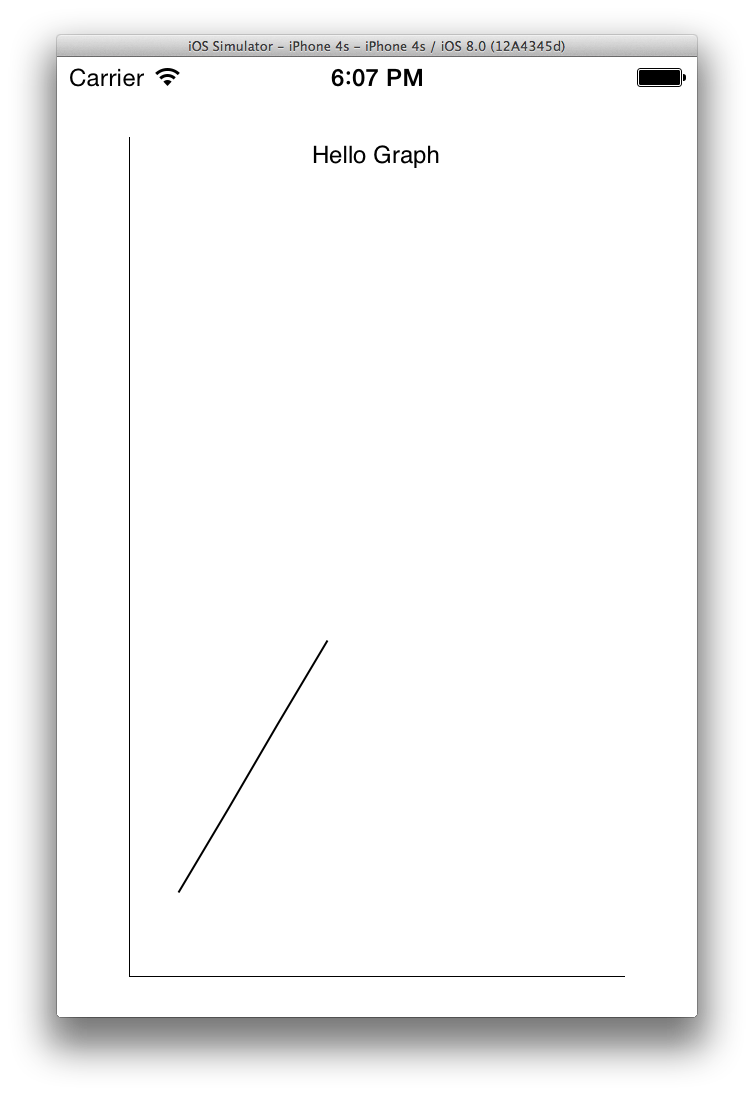
Cool. It’s not very pretty, but it’s showing all of our data now. As you come across other methods/properties that need an NSDecimal, you can create/add to your categories to wrap the functions.
Eventually, I imagine this will be solved either via Swift adding a way to deal with NSDecimal types, or by CorePlot switching to another data type, but for now it’ll get you by. There’s some discussion on the CorePlot github, which you may want to keep an eye on:
https://github.com/core-plot/core-plot/issues/96
The full code for this is available in the sample app for the previous post, under the nsdecimal-workaround branch here:
https://github.com/alwold/CorePlotTest/tree/nsdecimal-workaround
